Data sources: Esri, U.S. Census Bureau, Alexandria Office of Housing. Margins of error not indicated for 2018 USA Diversity Index. Alexandria’s 2018 Apartment Survey omits properties with fewer than 10 units, and certain others at the owners’ request. Committed affordable unit locations have been combined where appropriate for ease of viewing.
The Gazette Packet is piloting a series of maps intended to help citizens visualize relevant data, relationships, and trends in the city’s whole geographic context.
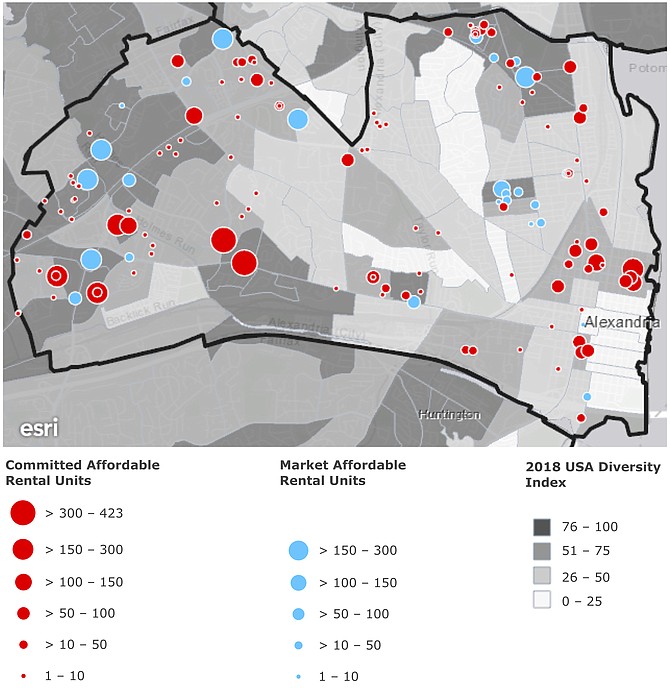
This first installment depicts racial diversity by census block and the locations of different kinds of affordable housing.
Esri’s 2018 USA Diversity Index “shows the likelihood [probability expressed as a percentage] that two persons, chosen at random from the same area, belong to different race or ethnic groups. The index ranges from zero (no diversity) to 100 (complete diversity),” according to Esri’s Living Atlas.
In general, low diversity doesn’t necessarily imply a preponderance. An all black or all Asian area would also have a low measure of diversity. However, in Alexandria’s case, the preponderance of non-Hispanic whites generally accounts for low diversity. Higher proportions of black and/or non-white Hispanic residents accounts for higher diversity.
“Affordable” housing, which represents only a fraction of the city’s housing stock, is categorized here as either “committed” or “market” affordable. Committed affordable units have contractually capped rents. Often, private and nonprofit developers have to keep rents at certain affordability levels in exchange for bigger building allowances from the city or federal tax credits awarded through the state. Several recent projects of this sort have targeted households making between 40-60 percent of the area median income (AMI) — roughly $50,000-70,000 per year for a family of four.
The committed affordable category here also includes public or otherwise publicly assisted housing belonging to the Alexandria Redevelopment and Housing Authority (ARHA). Technically, public housing can serve households earning up to 80 percent of the AMI — nearly $80,000 per year for a family of four. But in practice nearly all ARHA residents make $50,000 per year or less; about two-thirds make $25,000 or less; about a third make $10,000 or less.
While not pictured here, ARHA also administers nearly over 1,900 Housing Choice Vouchers (“Section 8”). These help residents making up to 50 percent of the AMI — just under $60,000 for a family of four — access the private rental stock. Vouchers make up the gap between what residents can afford and the market rent. To protect privacy, ARHA doesn’t publish addresses where residents use vouchers.
Market affordable units have unfixed rents, which are affordable to lower-income households under market conditions at a given time. Alexandria’s market affordable stock has collapsed, from just over 18,000 units in 2000 to just over 2,000 this year. Pictured here are units accessible to households making 40-60 percent of the AMI. Without assistance, households making less than that can access little to none of the private housing stock.
Write to gazette@connectionnewspapers with ideas for future Know Your City installments.